User Guide


Reporting and Analytics Dashboards
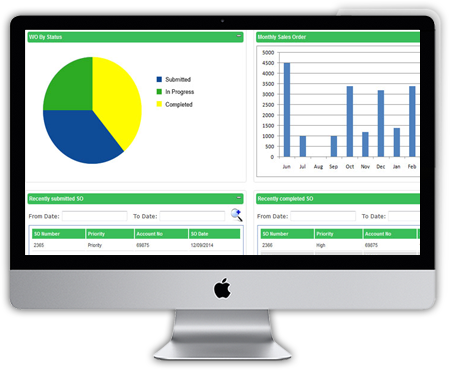
Labsols LIMS Reporting and Analytics Dashboard provide critical and important summary report and facts. The Dashboards helps to visually ascertain the status and health of a laboratory enterprise by providing graphical representation of tested samples monthly, representation of quality control of tested sample using frequency histogram, probability chart and Seamless embedded on demand reporting & data visualization tool
Analytics
Labsols LIMS is powered by Quinn Curtis which provides control and trend chart for displaying minute Statistical Report, Sample analysis data, Historic data for trend analysis
Reporting
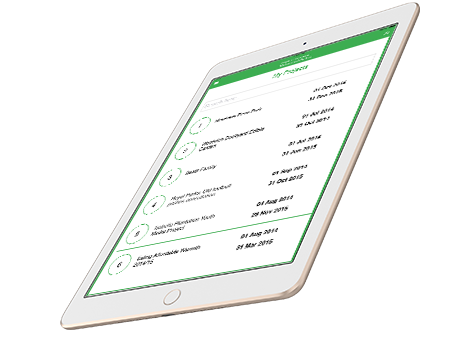
Labsols LIMS makes easier with the problem of handling huge data regarding the testing and inspection. The different kinds of report generated by the Reporting and Analytical solutions are:
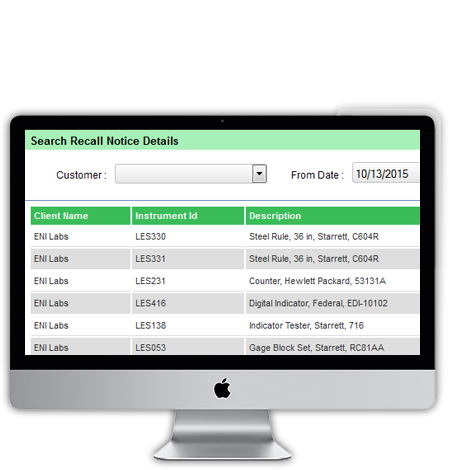
- General Search: Generate report on the basis of Client name/equipment name, Sample Point ID, Sample No, Status
- Multi Criteria Search: It is one of the most user friendly features where a user can add multiple search criteria to refine his/her search report.
- Historical Search: In Historical reporting you can get all the past data i.e. all the test/inspection done on a particular ship/ Navitec number.
- Samples Count: Sample count is one of the key features of Reporting System. Here you just need to put ship name/Navitec number and specify year. It will show how many test conducted on that ship's material month wise for the whole year.
- List of Unit Id: This is one of the USP of Reporting System. This feature of the application automatically sends a notification and a report about the test done on sample oil to the owner of ship or the concerned person of the ship.
- Samples in Progress : This report will show all the pending inspection/test data or those report where sample testing is in progress.
- Report Email scheduler: We can automatically set the report generation schedule in a specific format. And this report will be emailed to specific persons through backend routine.
Ad-hoc Query Tool
Labsols LIMS Reporting and Analytics provides Ad-hoc Query Tool which enables end-users to construct and execute complex queries against the database, with no technical skills, database administration experience, or knowledge of SQL required. Ad hoc query tool allows user to drag and drop the field and by this a customized report can be generated
Advanced Analytics
Labsols LIMS Reporting and Analytics provide various important features which are proved to be useful in oil testing industry
- Statistical Process Control (SPC) algorithm applied on test data gives a clear picture about the quality of the sample.
- Clients/lab coordinator need not to worry about the test result and does not need to check it manually or resend it again to the lab in case there is any deviation in the test result
- Dashboards and graphs or charts that summarize the report and visually represent critical performance and efficiency measures
- Reporting and Analytics offers annotation. A unique feature in which if a person changes any data, the report will generate a log file to show who and when changed the data.
Operational Intelligence
Labsols LIMS Reporting and Analytics keeps track all the test and analysis conducted on each samples and tightly integrates all the steps and all the process of the solution. Some key features are:
- The system have the functionality to send optional notification emails of stage and status changes to the Lab, Coordination, Client, Agent, Consultant and to the Vessel.
- Generate various kind of report which will contain all the necessary data or information
- Offer Clients with up-to-date information on key sample quality issues.